
Prepare data and compute processing feature#
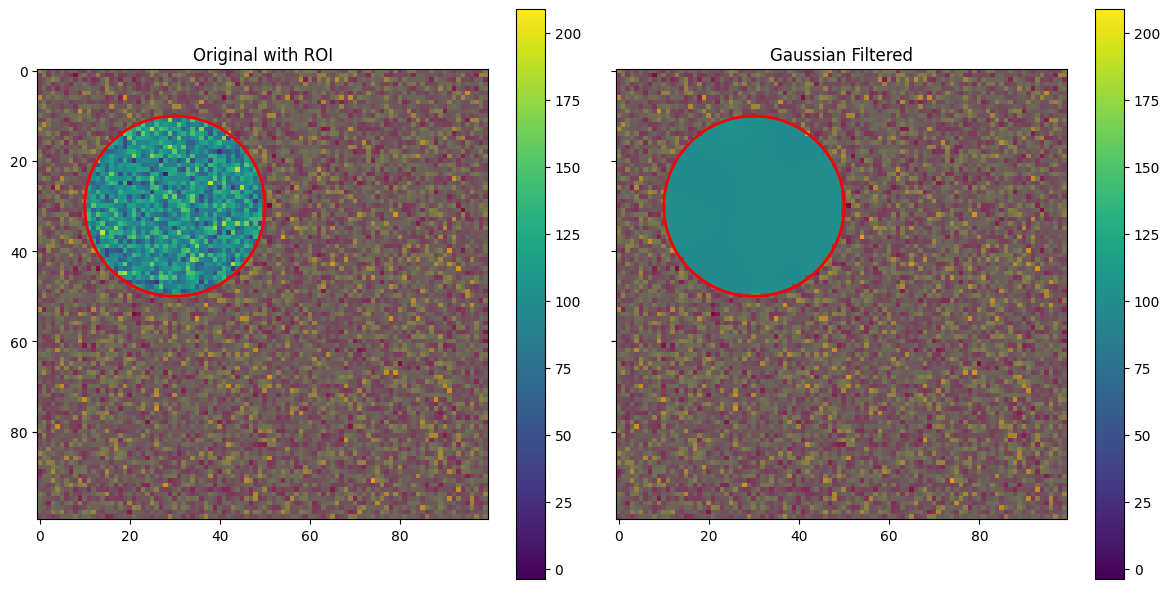
Demonstration of using Regions of Interest (ROIs) in image processing with Sigima
import numpy as np
import sigima.objects
import sigima.proc.image

# Generating a noisy image
data = np.random.normal(100, 30, (100, 100))

# Applying Gaussian filter on the image with the defined ROI
image = sigima.objects.create_image("Noisy", data)
image.roi = sigima.objects.create_image_roi("circle", [30, 30, 20])
result = sigima.proc.image.gaussian_filter(image, sigma=5.0)
result
Display results#
ℹ️ The following code use viz Matplotlib backend which has been introduced in Sigima V1.1
Sigima V1.0 uses an internal version of
vizfor image display based on PlotPy (tests.vistools).
from sigima.config import options

# This is only needed if you have both Matplotlib and PlotPy installed
options.viz_backend.set("matplotlib")
from sigima import viz

# Display results with Matplotlib
viz.view_images([image, result])
# Show ROI on the original image
image.roi
# Get statistics of the original image within the ROI
sigima.proc.image.stats(image)