Examples#

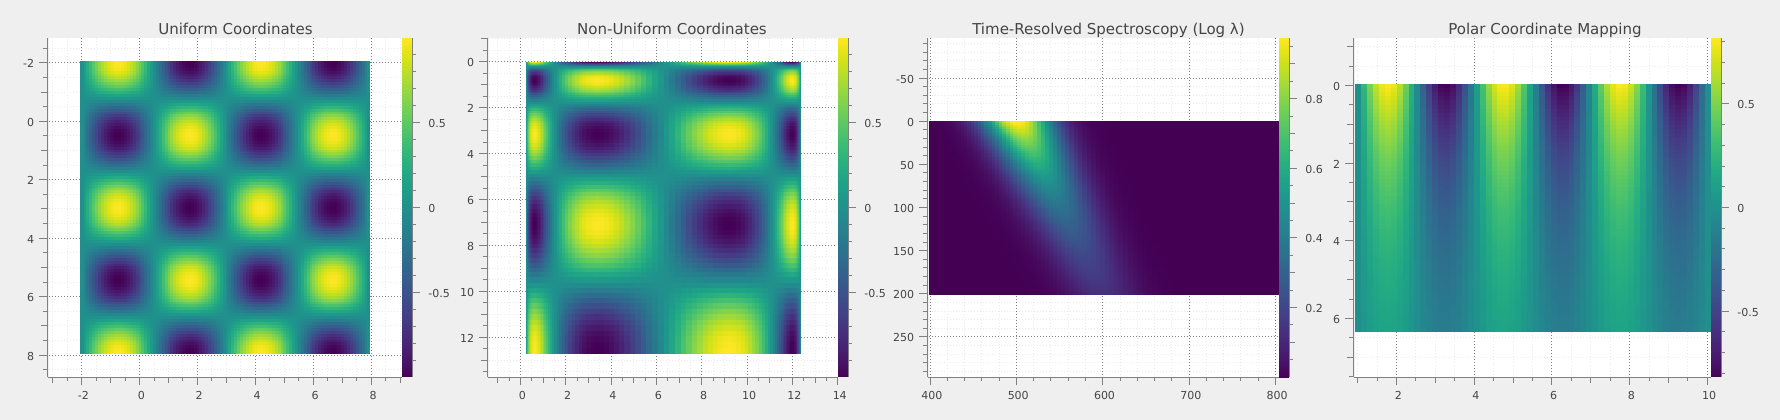
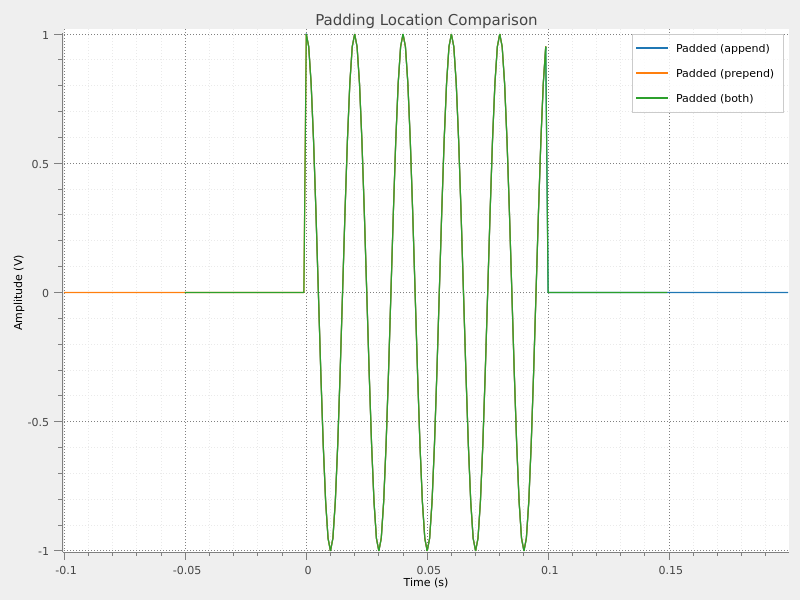
This section presents a collection of examples demonstrating the capabilities of Sigima. Each example is a standalone Python script that showcases specific features or use cases of the Sigima library, along with visualizations of the results (using the sigima.viz module with the PlotPyStack backend).

Of course, some of these examples may seem trivial, but they serve to illustrate how to use various functionalities of Sigima in a clear and concise manner.

Note

These examples are automatically generated when building the documentation, thus ensuring that they are always up-to-date with the latest version of Sigima.

Getting Started#

Creating Images

Creating Images

Creating Signals

Creating Signals

Use Cases#

Blob Detection

Blob Detection

Fabry-Perot Interference Pattern

Fabry-Perot Interference Pattern

Laser Beam Size Measurement Example

Laser Beam Size Measurement Example

Spectrum Analysis

Spectrum Analysis

Various Features#

Convolution and Deconvolution

Convolution and Deconvolution

DataLab remote control example

DataLab remote control example

DateTime Signal Processing

DateTime Signal Processing

ROI Grid Generation

ROI Grid Generation

Uniform and Non-Uniform Coordinate Systems

Uniform and Non-Uniform Coordinate Systems

Zero Padding for FFT Enhancement

Zero Padding for FFT Enhancement

Gallery generated by Sphinx-Gallery