
Note
Go to the end to download the full example code.
DateTime Signal Processing#
This example demonstrates how to work with signals that have datetime X-axis data in Sigima. DateTime support is essential for time-series analysis where you need to preserve human-readable timestamps while performing signal processing.
The example shows:
Creating signals from datetime objects and strings
Using different time units (hours, minutes, seconds, milliseconds, etc.)
Visualizing datetime signals with proper time formatting
CSV I/O with datetime preservation
Roundtrip testing across all supported time units
This tutorial uses PlotPy for visualization, providing interactive plots with properly formatted datetime axes.
Importing necessary modules#
We’ll start by importing all the required modules for datetime signal processing and visualization.
import tempfile
from datetime import datetime, timedelta
from pathlib import Path

import numpy as np

from sigima.io.signal.formats import CSVSignalFormat
from sigima.objects import SignalObj, create_signal
from sigima.objects.signal.constants import TIME_UNIT_FACTORS, VALID_TIME_UNITS
from sigima.viz import view_curves
Creating datetime signals from datetime objects#
The most common way to create datetime signals is from Python datetime objects. This is useful when you have timestamps from sensors, logs, or other time-series data.
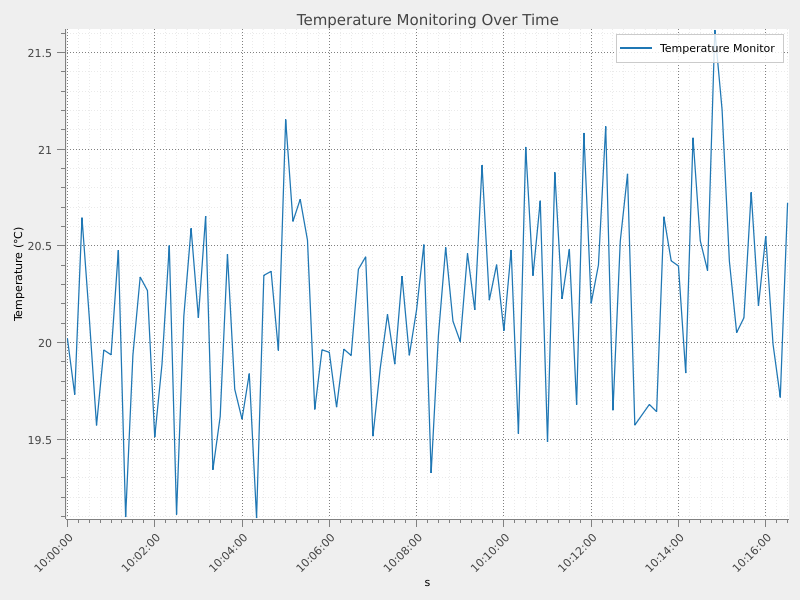
# Create a temperature monitoring signal with second-resolution timestamps
base_time = datetime(2025, 10, 7, 10, 0, 0)
timestamps = [base_time + timedelta(seconds=i * 10) for i in range(100)]

# Simulate temperature data with daily variation and noise
hours_elapsed = np.arange(100) * 10 / 3600  # Convert to hours
temperature = (
    20 + 5 * np.sin(2 * np.pi * hours_elapsed / 24) + np.random.randn(100) * 0.5
)

# Create the signal with datetime X-axis
temp_signal = create_signal("Temperature Monitor")
temp_signal.set_x_from_datetime(timestamps, unit="s", format_str="%H:%M:%S")
temp_signal.y = temperature
temp_signal.ylabel = "Temperature"
temp_signal.yunit = "°C"

print("✓ Temperature signal created successfully!")
print(f"Is datetime signal: {temp_signal.is_x_datetime()}")
print(f"Time unit: {temp_signal.xunit}")
print(f"First timestamp: {temp_signal.get_x_as_datetime()[0]}")
print(f"Last timestamp: {temp_signal.get_x_as_datetime()[-1]}")

# Visualize the temperature signal
view_curves(
    temp_signal,
    title="Temperature Monitoring Over Time",
    object_name="datetime_temperature",
)
✓ Temperature signal created successfully!
Is datetime signal: True
Time unit: s
First timestamp: 2025-10-07T10:00:00
Last timestamp: 2025-10-07T10:16:30
Creating datetime signals from string timestamps#
Often, datetime data comes as strings (e.g., from CSV files or logs). Sigima can automatically parse common datetime string formats.
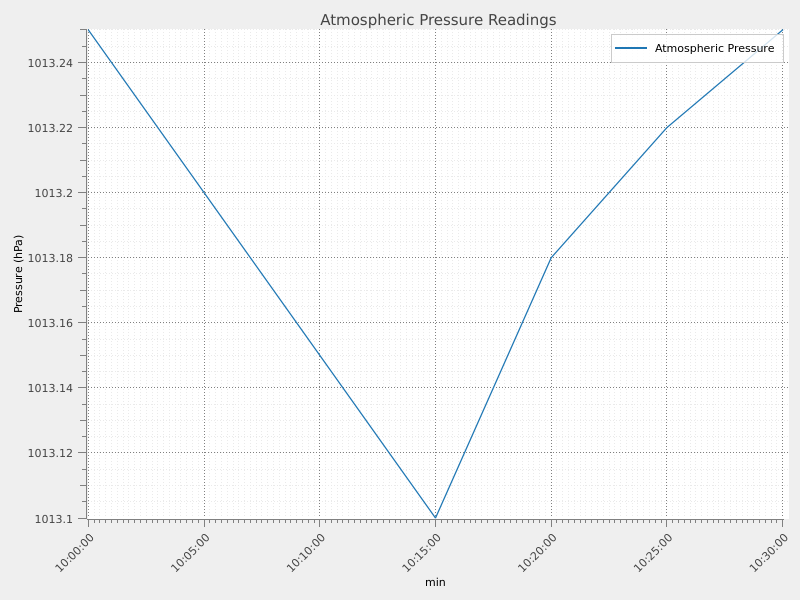
# Pressure monitoring with minute-resolution string timestamps
date_strings = [
    "2025-10-07 10:00:00",
    "2025-10-07 10:05:00",
    "2025-10-07 10:10:00",
    "2025-10-07 10:15:00",
    "2025-10-07 10:20:00",
    "2025-10-07 10:25:00",
    "2025-10-07 10:30:00",
]

# Simulate atmospheric pressure readings
pressure = np.array([1013.25, 1013.20, 1013.15, 1013.10, 1013.18, 1013.22, 1013.25])

pressure_signal = create_signal("Atmospheric Pressure")
pressure_signal.set_x_from_datetime(date_strings, unit="min", format_str="%H:%M:%S")
pressure_signal.y = pressure
pressure_signal.ylabel = "Pressure"
pressure_signal.yunit = "hPa"

print("\n✓ Pressure signal created from strings!")
print(f"Number of readings: {len(pressure_signal.y)}")
print(f"Pressure range: {pressure.min():.2f} - {pressure.max():.2f} hPa")

# Visualize the pressure signal
view_curves(
    pressure_signal,
    title="Atmospheric Pressure Readings",
    object_name="datetime_pressure",
)
✓ Pressure signal created from strings!
Number of readings: 7
Pressure range: 1013.10 - 1013.25 hPa
Using different time units#
Sigima supports various time units to match your data’s natural resolution: nanoseconds (ns), microseconds (us), milliseconds (ms), seconds (s), minutes (min), and hours (h).
print(f"\n✓ Supported time units: {', '.join(VALID_TIME_UNITS)}")
print("\nConversion factors to seconds:")
for unit, factor in TIME_UNIT_FACTORS.items():
print(f" 1 {unit:>3s} = {factor:>10.1e} seconds")
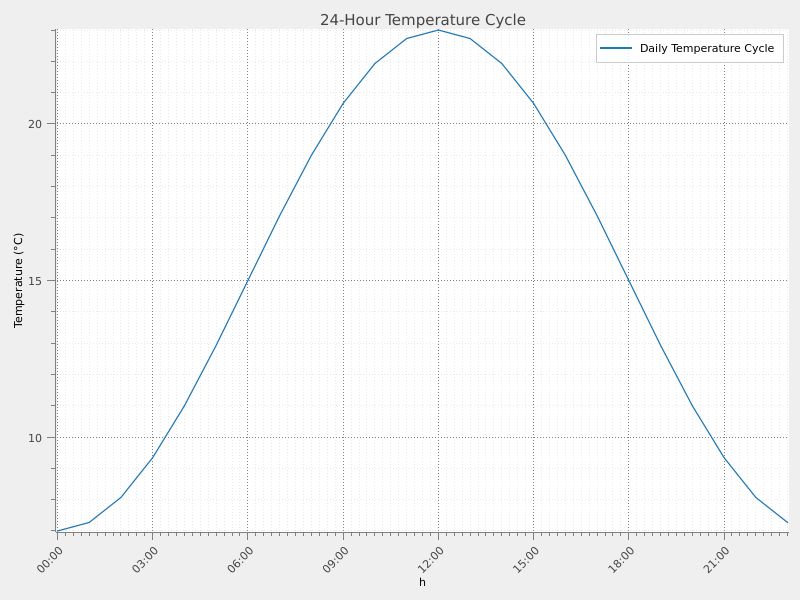
# Create hourly temperature cycle (24 hours)
hourly_base = datetime(2025, 10, 7, 0, 0, 0)
hourly_times = [hourly_base + timedelta(hours=i) for i in range(24)]
daily_temp = 15 + 8 * np.sin(2 * np.pi * (np.arange(24) - 6) / 24)
hourly_signal = SignalObj()
hourly_signal.set_x_from_datetime(hourly_times, unit="h", format_str="%H:%M")
hourly_signal.y = daily_temp
hourly_signal.title = "Daily Temperature Cycle"
hourly_signal.ylabel = "Temperature"
hourly_signal.yunit = "°C"
print("\n✓ Hourly signal created!")
print(f" Time unit: {hourly_signal.xunit}")
print(f" X-axis spacing: {np.diff(hourly_signal.x)[0]:.1f} hours")
print(f" Temperature range: {daily_temp.min():.1f}°C to {daily_temp.max():.1f}°C")
# Visualize the daily cycle
view_curves(
hourly_signal,
title="24-Hour Temperature Cycle",
object_name="datetime_hourly",
)
✓ Supported time units: ns, us, ms, s, min, h

Conversion factors to seconds:
   1  ns =    1.0e-09 seconds
   1  us =    1.0e-06 seconds
   1  ms =    1.0e-03 seconds
   1   s =    1.0e+00 seconds
   1 min =    6.0e+01 seconds
   1   h =    3.6e+03 seconds

✓ Hourly signal created!
   Time unit: h
   X-axis spacing: 3600.0 hours
   Temperature range: 7.0°C to 23.0°C
Comparing multiple datetime signals#
You can visualize multiple datetime signals together to compare trends.
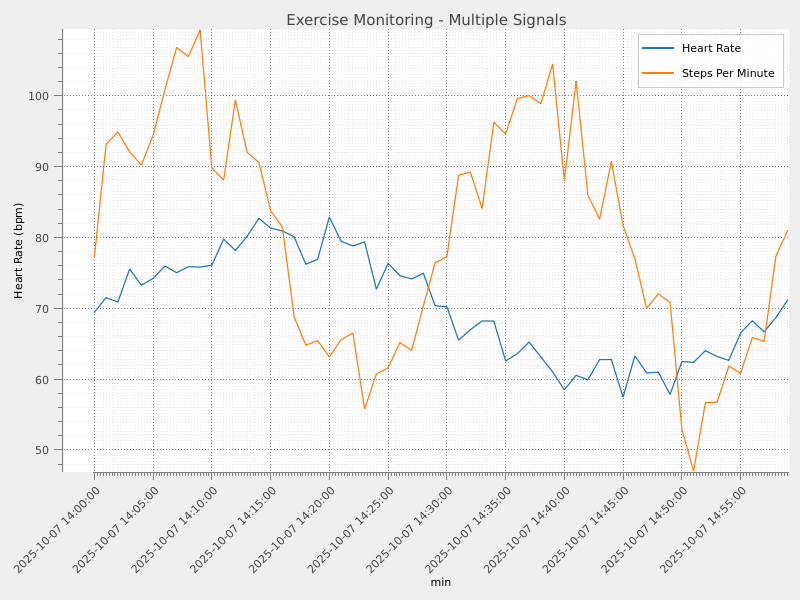
# Create three signals at different time scales
minute_base = datetime(2025, 10, 7, 14, 0, 0)
minute_times = [minute_base + timedelta(minutes=i) for i in range(60)]

# Heart rate over 1 hour
heart_rate = 70 + 10 * np.sin(2 * np.pi * np.arange(60) / 60) + 2 * np.random.randn(60)
hr_signal = SignalObj()
hr_signal.set_x_from_datetime(minute_times, unit="min")
hr_signal.y = heart_rate
hr_signal.title = "Heart Rate"
hr_signal.ylabel = "Heart Rate"
hr_signal.yunit = "bpm"

# Steps per minute
steps = 80 + 20 * np.sin(2 * np.pi * np.arange(60) / 30) + 5 * np.random.randn(60)
steps = np.clip(steps, 0, None)  # No negative steps
steps_signal = SignalObj()
steps_signal.set_x_from_datetime(minute_times, unit="min")
steps_signal.y = steps
steps_signal.title = "Steps Per Minute"
steps_signal.ylabel = "Steps"
steps_signal.yunit = "steps/min"

print("\n✓ Created multiple signals for comparison!")
print(f"   Heart rate avg: {heart_rate.mean():.1f} bpm")
print(f"   Steps avg: {steps.mean():.1f} steps/min")

# Visualize multiple signals together
view_curves(
    [hr_signal, steps_signal],
    title="Exercise Monitoring - Multiple Signals",
    object_name="datetime_multi",
)
✓ Created multiple signals for comparison!
   Heart rate avg: 70.2 bpm
   Steps avg: 80.3 steps/min
CSV I/O with datetime preservation#
Sigima automatically preserves datetime information when writing to CSV, storing timestamps as human-readable strings instead of opaque float values.
# Write temperature signal to CSV (using temporary directory)
temp_dir = tempfile.mkdtemp(prefix="sigima_")
csv_file = Path(temp_dir) / "temp_data.csv"
fmt = CSVSignalFormat()
fmt.write(str(csv_file), temp_signal)

print(f"\n✓ Saved datetime signal to CSV: {csv_file}")
print("   CSV Preview (first 5 lines):")
with open(csv_file, "r", encoding="utf-8") as f:
    for i, line in enumerate(f):
        if i < 5:
            print(f"      {line.rstrip()}")
        else:
            break

# Read it back and verify
loaded_signals = fmt.read(str(csv_file))
loaded_signal = loaded_signals[0]

# Verify datetime preservation
dt_original = temp_signal.get_x_as_datetime()
dt_loaded = loaded_signal.get_x_as_datetime()
data_matches = np.allclose(loaded_signal.y, temp_signal.y)
time_matches = np.all(dt_original == dt_loaded)

print("\n✓ Loaded signal from CSV successfully!")
print(f"   Is datetime: {loaded_signal.is_x_datetime()}")
print(f"   Data preserved: {data_matches}")
print(f"   Timestamps preserved: {time_matches}")
✓ Saved datetime signal to CSV: /tmp/sigima_faz6byo3/temp_data.csv
   CSV Preview (first 5 lines):
      Time,Temperature
      10:00:00,20.019320436448755
      10:00:10,19.73019423216731
      10:00:20,20.64563236253143
      10:00:30,20.13058174502713

✓ Loaded signal from CSV successfully!
   Is datetime: True
   Data preserved: True
   Timestamps preserved: False
Summary#
This example demonstrated the complete datetime signal workflow in Sigima:
Creating datetime signals from objects and strings
Multiple time units (ns, us, ms, s, min, h) stored in xunit attribute
Visualization with properly formatted datetime axes
CSV I/O with automatic datetime preservation
The time unit is stored in the signal’s xunit attribute, making it easy to access and consistent with other signal metadata. DateTime support makes Sigima ideal for time-series analysis, sensor data processing, and any application requiring human-readable temporal information.
print("\n" + "=" * 70)
print("✓ DateTime Signal Processing Example Completed Successfully!")
print("=" * 70)
======================================================================
✓ DateTime Signal Processing Example Completed Successfully!
======================================================================