
Note
Go to the end to download the full example code.
ROI Grid Generation#
This example focuses on generating grids of rectangular ROIs for systematic analysis of regular patterns in images using Sigima’s ROI grid feature. Using a real laser spot array image, we’ll explore how to create, configure, and apply ROI grids for extracting individual spots.
The example shows:
Loading a real-world laser spot array image
Extracting a sub-region for clearer visualization
Generating a grid of rectangular ROIs
Configuring grid parameters (size, translation, step spacing)
Understanding direction labels (row/column ordering)
Extracting individual spots using the generated ROIs
Visualizing the ROIs on the image
This tutorial uses PlotPy for visualization, providing interactive plots that allow you to explore the ROI grid placement in detail.
Importing necessary modules#
We’ll start by importing all the required modules for image processing and visualization.
from copy import deepcopy

from sigima import viz
from sigima.io import read_image
from sigima.objects import RectangularROI
from sigima.proc.image.extraction import (
    Direction,
    ROIGridParam,
    extract_roi,
    generate_image_grid_roi,
)
from sigima.tests import helpers
Loading a real laser spot array image#
We’ll use a laser spot array image with a 6×6 grid of spots. This is a realistic example where we need to analyze each spot individually.
# Load the laser spot array test image
filename = helpers.get_test_fnames("laser_spot_array.png", in_folder="image_formats")[0]
full_image = read_image(filename)
full_image.title = "Laser Spot Array (6×6)"

print("✓ Laser spot array image loaded!")
print(f"Image dimensions: {full_image.width} × {full_image.height} pixels")
print(f"Data type: {full_image.data.dtype}")
✓ Laser spot array image loaded!
Image dimensions: 456.0 × 467.0 pixels
Data type: uint8
Extracting a 2×2 sub-region#
For clearer visualization of the ROI grid feature, we’ll extract a 2×2 sub-region from the center of the full 6×6 spot array.
# Define a ROI to extract the central 2×2 spots
# The spots are roughly evenly distributed, so we calculate the region
cell_width = full_image.width / 6
cell_height = full_image.height / 6

# Extract spots from row 3-4 and column 3-4 (0-indexed: rows 2-3, cols 2-3)
x0 = cell_width * 2.0  # Start between column 2 and 3
y0 = cell_height * 2.0  # Start between row 2 and 3
roi_width = cell_width * 2  # 2 columns
roi_height = cell_height * 2  # 2 rows

# Create ROI and extract the sub-region
extraction_roi = RectangularROI([x0, y0, roi_width, roi_height], indices=False)
laser_image = extract_roi(full_image, extraction_roi.to_param(full_image, 0))
laser_image.title = "2×2 Spot Sub-region"

print("\n✓ Extracted 2×2 sub-region!")
print(
    f"Sub-region dimensions: {laser_image.width:.0f} × {laser_image.height:.0f} pixels"
)

# Display both images
viz.view_images_side_by_side(
    [full_image, laser_image],
    ["Full 6×6 Array", "Extracted 2×2 Sub-region"],
    title="Extracting a Sub-region for Analysis",
    share_axes=False,
)
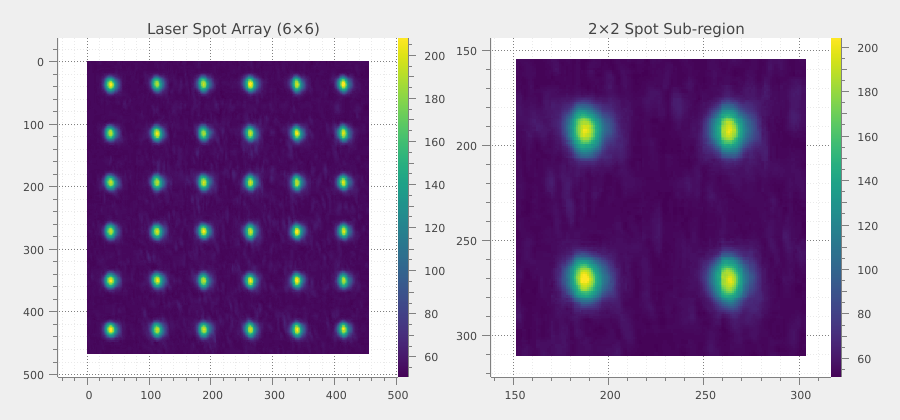
✓ Extracted 2×2 sub-region!
Sub-region dimensions: 152 × 155 pixels
Creating a basic grid of ROIs#
Now we’ll generate a 2×2 grid of ROIs to match the extracted spot array. Each ROI will be centered on a spot for individual analysis.
# Configure ROI grid parameters
param = ROIGridParam()
param.nx = param.ny = 2  # 2×2 grid to match the spots
param.xsize = param.ysize = 75  # Each ROI covers 75% of the cell size
param.xtranslation = param.ytranslation = 50  # Centered (50% = center)
param.xstep = param.ystep = 100  # 100% = evenly distributed grid
param.xdirection = param.ydirection = Direction.INCREASING
param.base_name = "Spot"
param.name_pattern = "{base}({r},{c})"

# Generate the ROI grid (this doesn't modify the source image)
roi_grid = generate_image_grid_roi(laser_image, param)

# Assign ROIs to a copy of the image for visualization
image_with_roi = laser_image.copy()
image_with_roi.roi = roi_grid
image_with_roi.title = "2×2 ROI Grid"

print(f"\n✓ Generated {len(list(roi_grid))} rectangular ROIs!")
print("ROI titles:", [r.title for r in list(roi_grid)])

# Display image with ROI overlay
viz.view_images_side_by_side(
    [laser_image, image_with_roi],
    ["2×2 Spot Array", "With ROI Grid"],
    title="Basic ROI Grid (2×2, Centered)",
)
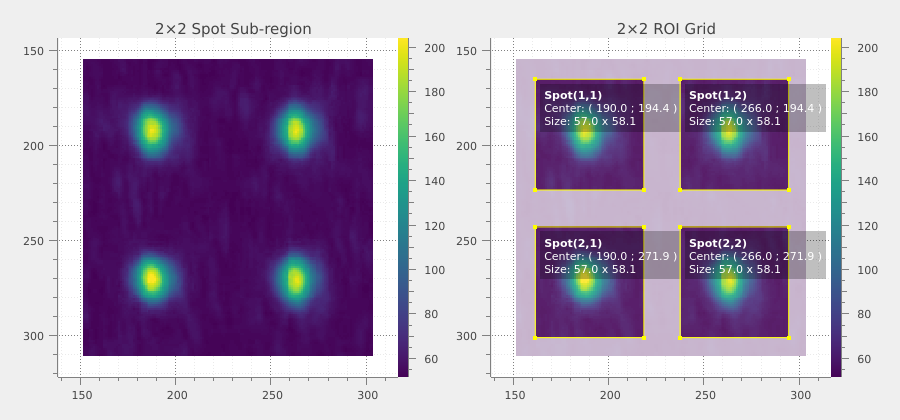
✓ Generated 4 rectangular ROIs!
ROI titles: ['Spot(1,1)', 'Spot(1,2)', 'Spot(2,1)', 'Spot(2,2)']
Extracting individual spots#
Once the ROI grid is defined, we can extract individual spots as separate images for further analysis.
# Extract a few spots as individual images
extracted_spots = []
for i, roi_item in enumerate(roi_grid):
    if i >= 4:  # Extract first 4 spots for demonstration
        break
    roi_param = roi_item.to_param(laser_image, 0)
    spot_image = extract_roi(laser_image, roi_param)
    spot_image.title = roi_item.title
    extracted_spots.append(spot_image)

print(f"\n✓ Extracted {len(extracted_spots)} individual spot images!")
for spot in extracted_spots:
    print(f"  - {spot.title}: {spot.width}×{spot.height} pixels")

# Display extracted spots
viz.view_images_side_by_side(
    extracted_spots,
    [spot.title for spot in extracted_spots],
    title="Extracted Individual Spots",
    share_axes=False,
    rows=2,
)
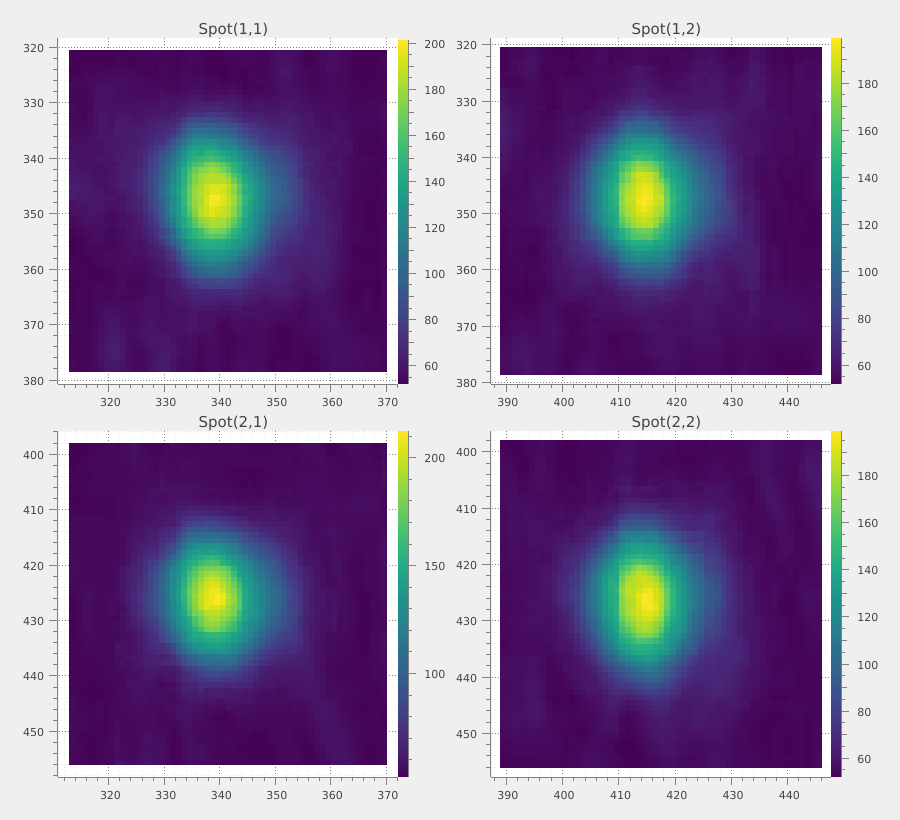
✓ Extracted 4 individual spot images!
  - Spot(1,1): 57.0×58.0 pixels
  - Spot(1,2): 57.0×58.0 pixels
  - Spot(2,1): 57.0×58.0 pixels
  - Spot(2,2): 57.0×58.0 pixels
Adjusting ROI size and position#
The ROI size and translation parameters control how the ROIs are placed within each grid cell. Let’s explore different configurations.
# Configuration 1: Larger ROIs (90% of cell size)
param_large = deepcopy(param)
param_large.xsize = param_large.ysize = 90

image_large = laser_image.copy()
image_large.roi = generate_image_grid_roi(laser_image, param_large)
image_large.title = "Large ROIs (90%)"

# Configuration 2: Smaller ROIs (40% of cell size)
param_small = deepcopy(param)
param_small.xsize = param_small.ysize = 40

image_small = laser_image.copy()
image_small.roi = generate_image_grid_roi(laser_image, param_small)
image_small.title = "Small ROIs (40%)"

# Configuration 3: Shifted position (translation offset)
param_shifted = deepcopy(param)
param_shifted.xtranslation = 60  # Shift right by 10%
param_shifted.ytranslation = 40  # Shift up by 10%

image_shifted = laser_image.copy()
image_shifted.roi = generate_image_grid_roi(laser_image, param_shifted)
image_shifted.title = "Shifted ROIs"

print("\n✓ Generated ROI grids with different configurations!")
print("  - Large ROIs: 90% of cell size")
print("  - Small ROIs: 40% of cell size")
print("  - Shifted ROIs: offset by 10% in X and Y")

# Display the different configurations
viz.view_images_side_by_side(
    [image_with_roi, image_large, image_small, image_shifted],
    ["Default (75%)", "Large (90%)", "Small (40%)", "Shifted (+10%)"],
    title="ROI Size and Position Variations",
)
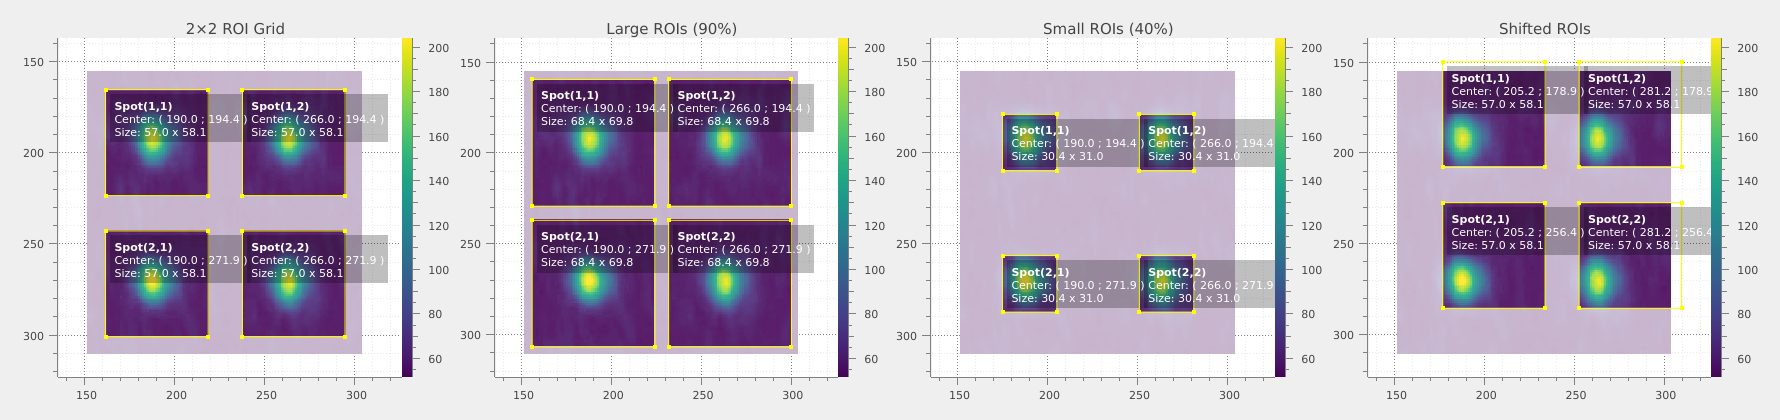
✓ Generated ROI grids with different configurations!
  - Large ROIs: 90% of cell size
  - Small ROIs: 40% of cell size
  - Shifted ROIs: offset by 10% in X and Y
Understanding direction labels#
The xdirection and ydirection parameters control how rows and columns are numbered. This affects the ROI titles but not the geometry.
# Increasing direction (default): row 1 at top, column 1 at left
param_inc = deepcopy(param)
param_inc.xdirection = param_inc.ydirection = Direction.INCREASING

image_inc = laser_image.copy()
image_inc.roi = generate_image_grid_roi(laser_image, param_inc)
image_inc.title = "Increasing (R1 top, C1 left)"

# Decreasing direction: row 1 at bottom, column 1 at right
param_dec = deepcopy(param)
param_dec.xdirection = param_dec.ydirection = Direction.DECREASING

image_dec = laser_image.copy()
image_dec.roi = generate_image_grid_roi(laser_image, param_dec)
image_dec.title = "Decreasing (R1 bottom, C1 right)"

# Show the first few ROI titles for comparison
roi_inc = generate_image_grid_roi(laser_image, param_inc)
roi_dec = generate_image_grid_roi(laser_image, param_dec)

print("\n✓ Direction affects ROI labeling, not geometry!")
print("Increasing direction (first 4 ROIs):", [r.title for r in list(roi_inc)[:4]])
print("Decreasing direction (first 4 ROIs):", [r.title for r in list(roi_dec)[:4]])

# Display direction variations
viz.view_images_side_by_side(
    [image_inc, image_dec],
    ["Increasing Direction", "Decreasing Direction"],
    title="ROI Direction Labels",
)
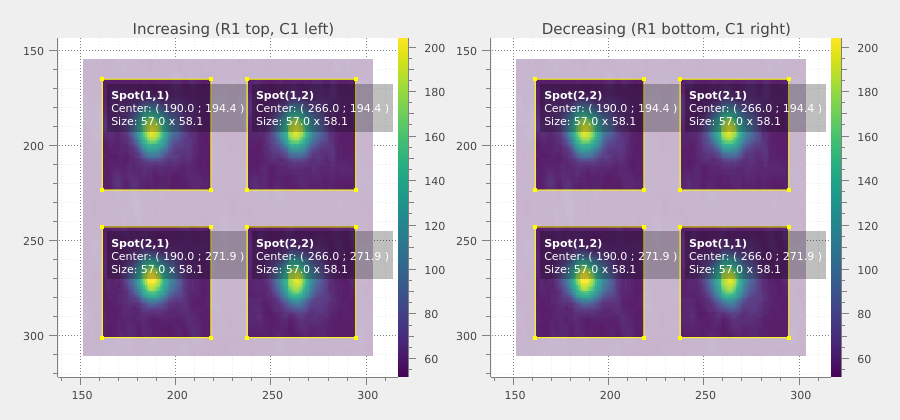
✓ Direction affects ROI labeling, not geometry!
Increasing direction (first 4 ROIs): ['Spot(1,1)', 'Spot(1,2)', 'Spot(2,1)', 'Spot(2,2)']
Decreasing direction (first 4 ROIs): ['Spot(2,2)', 'Spot(2,1)', 'Spot(1,2)', 'Spot(1,1)']
Summary and conclusions#
This tutorial demonstrated the key concepts of ROI grid generation for systematic analysis of regular patterns in images using Sigima.
print("\n" + "=" * 60)
print("ROI GRID TUTORIAL SUMMARY")
print("=" * 60)
print("✓ Loaded real-world laser spot array image")
print("✓ Generated grids of rectangular ROIs")
print("✓ Configured grid parameters (size, translation, step spacing)")
print("✓ Explored direction labels (row/column ordering)")
print("✓ Extracted individual spots using generated ROIs")
print("✓ Visualized ROIs overlaid on images")
print("\nKey Takeaways:")
print("• Grid dimensions (nx, ny) define the number of rows and columns")
print("• ROI size (xsize, ysize) controls the coverage as percentage of cell size")
print("• Translation (xtranslation, ytranslation) offsets position within cells")
print("• Direction (xdirection, ydirection) controls row/column numbering order")
print(
    "• ROI grids are ideal for analyzing arrays of spots, sensors, or regular patterns"
)
============================================================
ROI GRID TUTORIAL SUMMARY
============================================================
✓ Loaded real-world laser spot array image
✓ Generated grids of rectangular ROIs
✓ Configured grid parameters (size, translation, step spacing)
✓ Explored direction labels (row/column ordering)
✓ Extracted individual spots using generated ROIs
✓ Visualized ROIs overlaid on images

Key Takeaways:
• Grid dimensions (nx, ny) define the number of rows and columns
• ROI size (xsize, ysize) controls the coverage as percentage of cell size
• Translation (xtranslation, ytranslation) offsets position within cells
• Direction (xdirection, ydirection) controls row/column numbering order
• ROI grids are ideal for analyzing arrays of spots, sensors, or regular patterns